
Per-Number Load and Outbound Call Performance
What 45 million calls show about spam flags, daily volume and stable operating ranges
White paper 1 of 2 · September 2026
Based on 45.2 million outbound calls (April – September, 2026). Companion paper: Spam Engines and Carrier Filtering.
Executive summary
Clients often assume that falling answer rates mean numbers have been flagged as spam and must be replaced. Our call data does not support that as the main explanation. An individual number receiving spam status, or dipping in performance for several days, does not by itself cause lasting damage: in most cases the dip is temporary.
The data does show a consistent relationship between volume and quality. Across every destination examined, effective ASR (15+ seconds) is lower on high-volume days than on moderate ones, and the pattern is clearest when load per origination number rises. In Brazil, average effective ASR 15+ fell about 20% when daily traffic exceeded 70K calls.
We estimate stable daily call volumes per origination number for twelve destinations (for example Japan 16–27, India 28–46, Poland 16–41) and recommend that clients operate within them. The estimates are directional: campaign changes on the client side cannot be excluded as a contributing factor.
1. Introduction
Clients running high-volume outbound voice campaigns regularly see answer rates fall over time. The natural assumption is that numbers are being flagged as spam and that replacing them restores performance. This paper tests that assumption against our own traffic data.
It addresses two questions:
- Does an individual number lose performance when it receives spam status or shows a dip?
- Is overall performance related to how much traffic is sent per destination and per number, and if so, is there an operating range that performs best?
A companion paper, Spam Engines and Carrier Filtering, uses the same data set and examines the external mechanisms that may explain the patterns reported here.
2. Data and Method
The analysis uses our own call records for the period below. Performance is measured with ASR (answer-seizure ratio), effective ASR at several minimum-duration thresholds (5, 10, 15 and 20 seconds), and ACD (average call duration). Effective ASR 15+ is used as the main quality indicator because it counts only calls answered and held for at least 15 seconds, filtering out immediate hang-ups and automated rejections.
| Individual calls | First date | Last date | Calendar days | Distinct numbers called | Distinct countries |
|---|---|---|---|---|---|
| 45,224,257 | Apr 1, 2026 | Sep 18, 2026 | 171 | 10,638,360 | 104 |
Two complementary views were taken. The first follows individual origination numbers (DIDs) through time, including around spam flags and unflagged declines. The second aggregates by day and destination to compare performance against total traffic and against the number of origination numbers in use. A script then estimated a normal daily call volume per number for each destination where the data allowed.
3. Finding 1: Individual Number Status Is Not the Main Driver
3.1 Spam status and short-term dips
Looking at individual numbers, we found no significant, lasting impact on performance when a number received spam status or had a dip. In the majority of cases the dip is temporary. Two observations support this:
- Flagged numbers are usually withdrawn. When a number receives spam status, the client typically stops using it promptly, so for most flagged numbers there is little performance data afterwards. Where numbers were kept in use, performance did not suffer drastically and in some cases was better than before the flag.
- Unflagged declines recover. We selected numbers whose effective ASR 15+ fell steadily for several days without being flagged in any system we check, and which therefore stayed in use. Across destinations there is no consistent downward trend: these numbers return to roughly their earlier performance at seemingly random intervals.
3.2 A heavily used number as illustration
One heavily used DID (8150310xxxxx) was examined in successive blocks of 1,000 calls, drawn from all the traffic it carried. Performance moves around but does not decay with use: ASR stayed between 42.8% and 55.2% across eleven blocks, effective ASR 15+ between 7.4% and 10.0%, and the final partial block of 203 calls recorded 52.2% ASR and 13.3% effective ASR 15+. A wider selection of DIDs shows the same lack of linear decline with extensive use.
This does not mean spam labels are harmless. It means that, in our data, the state of a single number is a weak predictor of its future performance, and replacing numbers on the basis of a flag alone is unlikely to be the most effective lever.
4. Finding 2: Performance Falls as Load Rises
4.1 Destination-level volume
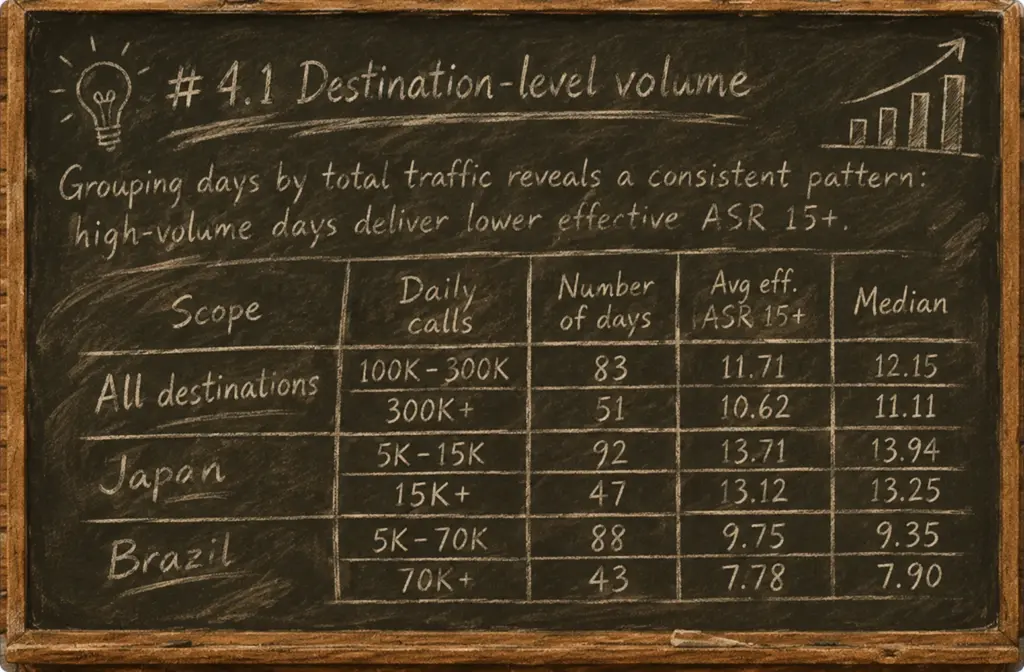
Grouping days by total traffic reveals a consistent pattern: high-volume days deliver lower effective ASR 15+ than moderate-volume days.
| Scope | Daily calls | Number of days | Avg eff. ASR 15+ | Median |
|---|---|---|---|---|
| All destinations | 100K–300K | 83 | 11.71 | 12.15 |
| 300K+ | 51 | 10.62 | 11.11 | |
| Japan | 5K–15K | 92 | 13.71 | 13.94 |
| 15K+ | 47 | 13.12 | 13.25 | |
| Brazil | 5K–70K | 88 | 9.75 | 9.35 |
| 70K+ | 43 | 7.78 | 7.90 |
The direction of the effect is the same for every destination in the data set, though its size varies widely.
4.2 Load per origination number
Volume alone is not the whole story. Days that combine high traffic with many origination numbers behave differently from days that concentrate traffic on few numbers. Table 3 compares days within the same destination and month, where lead quality is therefore likely to be comparable.
| Date | Country | Total calls | Origination numbers | Calls per number | ASR (%) | Eff. ASR 15+ (%) | ACD (sec) |
|---|---|---|---|---|---|---|---|
| Jul 4 | Japan | 1,075 | 353 | 3.0 | 59.1 | 26.6 | 42.4 |
| Jul 15 | Japan | 14,311 | 647 | 22.1 | 48.9 | 18.5 | 67.3 |
| Jul 1 | Japan | 20,841 | 665 | 31.3 | 44.5 | 13.2 | 51.0 |
| May 15 | Japan | 22,602 | 685 | 33.0 | 40.8 | 12.0 | 61.3 |
| Jul 1 | Switzerland | 7,362 | 1,584 | 4.6 | 60.4 | 19.7 | 35.5 |
| Jul 29 | Switzerland | 15,839 | 1,596 | 9.9 | 60.1 | 13.3 | 21.7 |
| Jul 31 | Switzerland | 23,090 | 1,688 | 13.7 | 53.3 | 9.4 | 19.8 |
| Jul 25 | Chile | 210 | 55 | 3.8 | 36.2 | 14.3 | 21.0 |
| Jul 13 | Chile | 2,008 | 111 | 18.1 | 26.7 | 12.5 | 64.2 |
| Jul 8 | Chile | 2,067 | 115 | 18.0 | 26.2 | 10.2 | 52.8 |
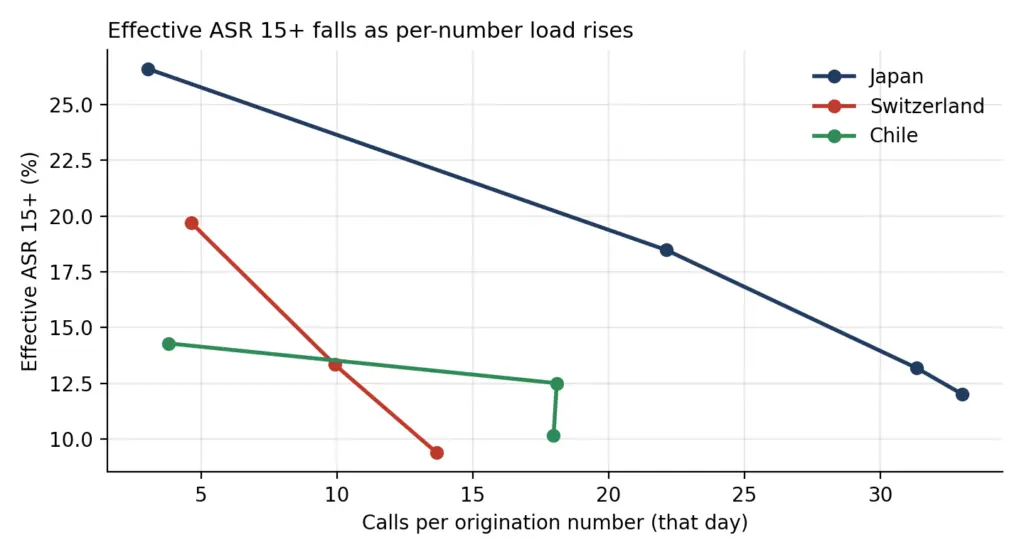
Japan is the clearest case. The best day in the period for effective ASR 15+ (26.6%, on July 4) had only 1,075 calls but a large pool of 353 numbers. Nearly doubling the numbers to 647 while raising traffic to over 14,000 calls cut effective ASR 15+ to 18.5%, and a further rise to about 21,000 calls cut it to 13.2%. The highest-volume day of the period, with 22,602 calls, recorded 12.0%. Switzerland shows the same shape with a nearly constant number pool, and Chile, included as a LATAM reference, follows the trend at much smaller scale.
5. Estimated Stable Load per Number
If quality declines as load per number rises, there should be an operating range that performs best. A script was built to approximate this for each destination using current data. Table 4 lists the destinations where the analysis was solid enough to report.
| Destination | Evidence | Estimated normal calls/day | Supported range (× normal) | Approx. stable calls/day | Deterioration begins around |
|---|---|---|---|---|---|
| Japan | High | 22 | 0.75–1.25× | 16–27 | 33 (1.5×) |
| India | High | 37 | 0.75–1.25× | 28–46 | 56 (1.5×) |
| Poland | High | 21 | 0.75–2.00× | 16–41 | 42 (2×) |
| Malaysia | Moderate | 114 | 0.75–1.50× | 85–170 | 228 (2×) |
| Greece | Moderate | 46 | 0.75–2.00× | 35–92 | 93 (2×) |
| Canada | Moderate | 13 | 0.75–1.25× | 10–16 | 20 (1.5×) |
| Germany | Moderate | 9 | 0.75–3.00× | 7–27 | 28 (3×) |
| Austria | Moderate | 98 | 0.75–1.50× | 74–147 | 148 (1.5×) |
| Nigeria | Moderate | 81 | 0.75–1.25× | 60–100 | 101 (1.25×) |
| Norway | Moderate | 31 | 0.75–1.25× | 23–38 | 39 (1.25×) |
| Sweden | Moderate | 38 | 0.75–1.50× | 28–56 | 57 (1.5×) |
| Switzerland | Moderate | 26 | 0.75–1.50× | 20–39 | ~40 |
The acceptable load per number differs by an order of magnitude between destinations, from roughly 10–16 calls a day in Canada to 85–170 in Malaysia.
These figures agree with the daily observations in Section 4: the Japan days at about 22 calls per number sit at the estimated normal level, while the days at 31–33 calls per number are at or past the point where deterioration begins.
6. Limitations
Some care is needed in interpreting these results, because key factors sit on the client’s side of the network and are not visible to us.
- Campaign mix. Clients may increase traffic by connecting a new campaign, and that campaign may simply have lower lead quality. The volume–quality relationship could then reflect who is being called rather than how many calls are made.
- Expected calls. Lower-volume days may include calls that recipients expect, for example from a retention team, which would naturally raise answer rates.
- Estimation. The per-number ranges in Table 4 come from a script over observed data. Evidence strength varies by destination, and most destinations are rated moderate.
- Scope. This paper describes what happens in our call records. It does not identify which detection engines or carriers, if any, are responsible; see the companion paper.
Even so, the data quality is good enough that the pattern should be taken seriously.
7. Recommendations
- Operate within the stable range. Keep daily calls per origination number inside the ranges in Table 4 for each destination, and treat the “deterioration begins around” values as a ceiling to test carefully.
- Spread traffic across more numbers rather than more calls per number. The Japan and Switzerland comparisons suggest that a larger pool at lower per-number load holds effective ASR 15+ better.
- Set limits per destination. Acceptable load varies by an order of magnitude across routes, so one global cap is not appropriate.
- Avoid reflexive number replacement. Because dips are usually temporary, replace numbers when performance data and load justify it, not only when a flag appears.
- Validate with controlled tests. Because client-side factors cannot be excluded, run comparisons on the same campaign at different per-number loads before adopting the ranges as fixed policy.
8. Conclusion
In our data, individual numbers recover from dips, while higher daily load, and especially higher load per origination number, is associated with lower effective ASR 15+ in every destination examined. The acceptable load differs greatly by destination, from roughly 10–16 calls per number per day in Canada to 85–170 in Malaysia.
Client-side factors mean the relationship cannot be treated as proven cause and effect. Even so, the recommended per-number ranges are the best available estimate, and a client that holds to them is likely to improve performance.
References
- Internal call data, April 1 – September 18, 2026 (45.2 million calls; 10.6 million distinct numbers called; 104 countries).
- Companion paper: Spam Engines and Carrier Filtering (September 2026).
← Back to Insights & News